Engage Thrusters
Performance 2.0
In my last post, I left off with an overall 25%ish improvement in framerate for my test case:
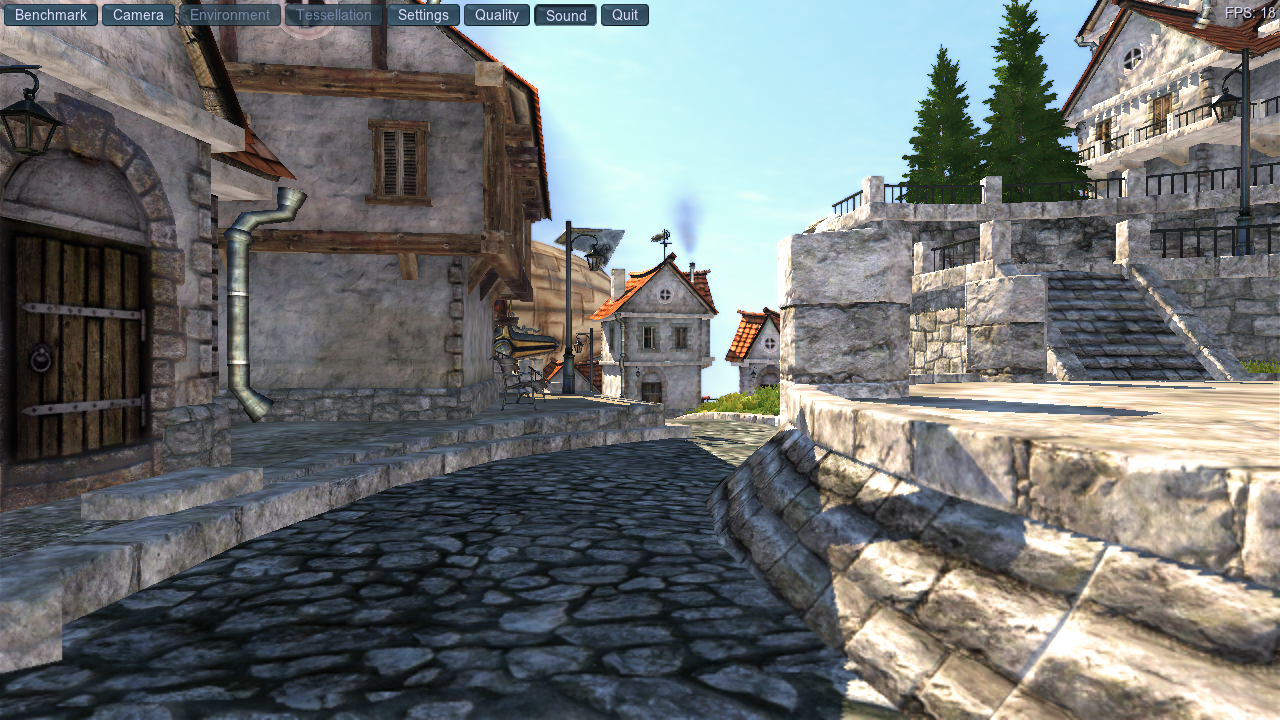
At the end, this was an extra 3 fps over my previous test, but how did I get to this point?
The answer lies in even more unnecessary queue submission. Let’s take a look at zink’s pipe_context::set_framebuffer_state hook, which is called by gallium any time the framebuffer state changes:
static void
zink_set_framebuffer_state(struct pipe_context *pctx,
                           const struct pipe_framebuffer_state *state)
{
   struct zink_context *ctx = zink_context(pctx);
   struct zink_screen *screen = zink_screen(pctx->screen);

   util_copy_framebuffer_state(&ctx->fb_state, state);

   struct zink_framebuffer *fb = get_framebuffer(ctx);

   zink_framebuffer_reference(screen, &ctx->framebuffer, fb);
   if (ctx->gfx_pipeline_state.render_pass != fb->rp)
      ctx->gfx_pipeline_state.hash = 0;
   zink_render_pass_reference(screen, &ctx->gfx_pipeline_state.render_pass, fb->rp);

   uint8_t rast_samples = util_framebuffer_get_num_samples(state);
   /* in vulkan, gl_SampleMask needs to be explicitly ignored for sampleCount == 1 */
   if ((ctx->gfx_pipeline_state.rast_samples > 1) != (rast_samples > 1))
      ctx->dirty_shader_stages |= 1 << PIPE_SHADER_FRAGMENT;
   if (ctx->gfx_pipeline_state.rast_samples != rast_samples)
      ctx->gfx_pipeline_state.hash = 0;
   ctx->gfx_pipeline_state.rast_samples = rast_samples;
   if (ctx->gfx_pipeline_state.num_attachments != state->nr_cbufs)
      ctx->gfx_pipeline_state.hash = 0;
   ctx->gfx_pipeline_state.num_attachments = state->nr_cbufs;

   /* need to start a new renderpass */
   if (zink_curr_batch(ctx)->rp)
      flush_batch(ctx);
   struct zink_batch *batch = zink_batch_no_rp(ctx);
   zink_framebuffer_reference(screen, &batch->fb, fb);

   framebuffer_state_buffer_barriers_setup(ctx, &ctx->fb_state, zink_curr_batch(ctx));
}
Briefly, zink copies the framebuffer state, there’s a number of conditions under which a new pipeline object is needed, which all result in ctx->gfx_pipeline_state.hash = 0;. Other than this, there’s sample count check for sample changes so that the shader can be modified if necessary, and then there’s the setup for creating the Vulkan framebuffer object as well as the renderpass object in get_framebuffer().
Eagle-eyed readers will immediately spot the problem here, which is, aside from the fact that there’s not actually any reason to be setting up the framebuffer or renderpass here, how zink is also flushing the current batch if a renderpass is active.
The change I made here was to remove everything related to Vulkan from here, and move it to zink_begin_render_pass(), which is the function that the driver uses to begin a renderpass for a given batch.
This is clearly a much larger change than just removing the flush_batch() call, which might be what’s expected now that ending a renderpass no longer forces queue submission. Indeed, why haven’t I just ended the current renderpass and kept using the same batch?
The reason for this is that zink is designed in such a way that a given batch, at the time of calling vkCmdBeginRenderPass, is expected to either have no struct zink_render_pass associated with it (the batch has not performed a draw yet) or have the same object which matches the pipeline state (the batch is continuing to draw using the same renderpass). Adjusting this to be compatible with removing the flush here ends up being more code than just moving the object setup to a different spot.
So now the framebuffer and renderpass are created or pulled from their caches just prior to the vkCmdBeginRenderPass call, and a flush is removed, gaining some noticeable fps.
Going Further
Now that I’d unblocked that bottleneck, I went back to the list and checked the remaining problem areas:
- descriptor set allocation is going to be a massive performance hit for any application which does lots of draws per frame since each draw command allocates its own (huge) descriptor set
- the 1000 descriptor set limit is going to be hit constantly for for any application which does lots of draws per frame
I decided to change things up a bit here.

This is the current way of things.
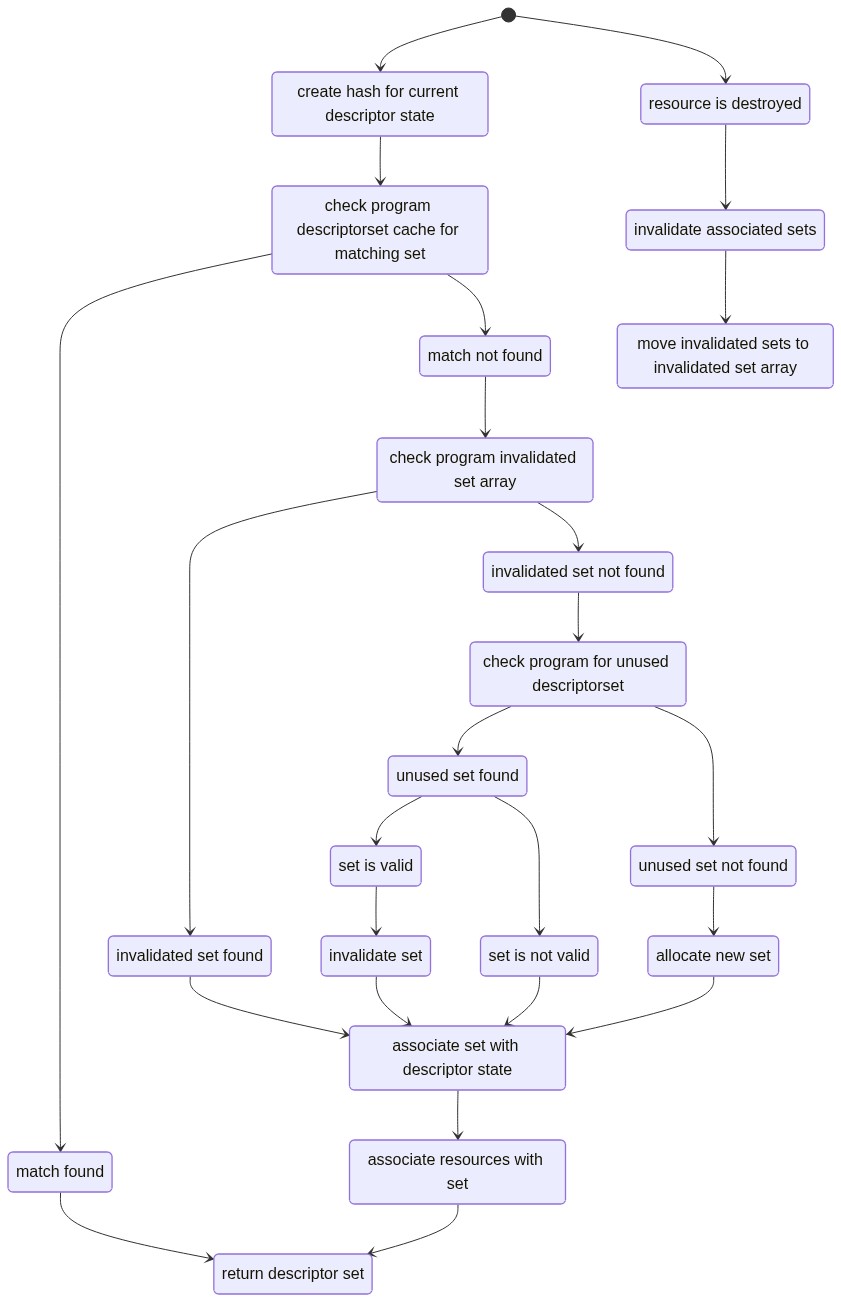
My plan was something more like this:
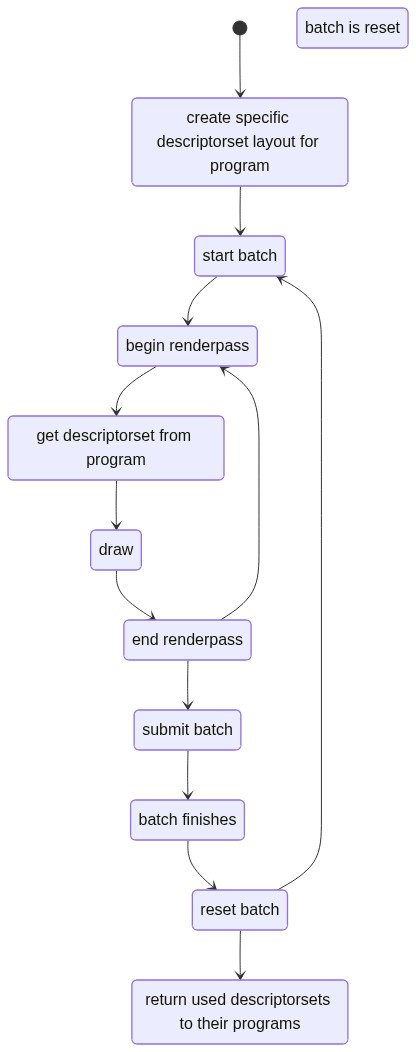
Where get descriptorset from program would look something like:
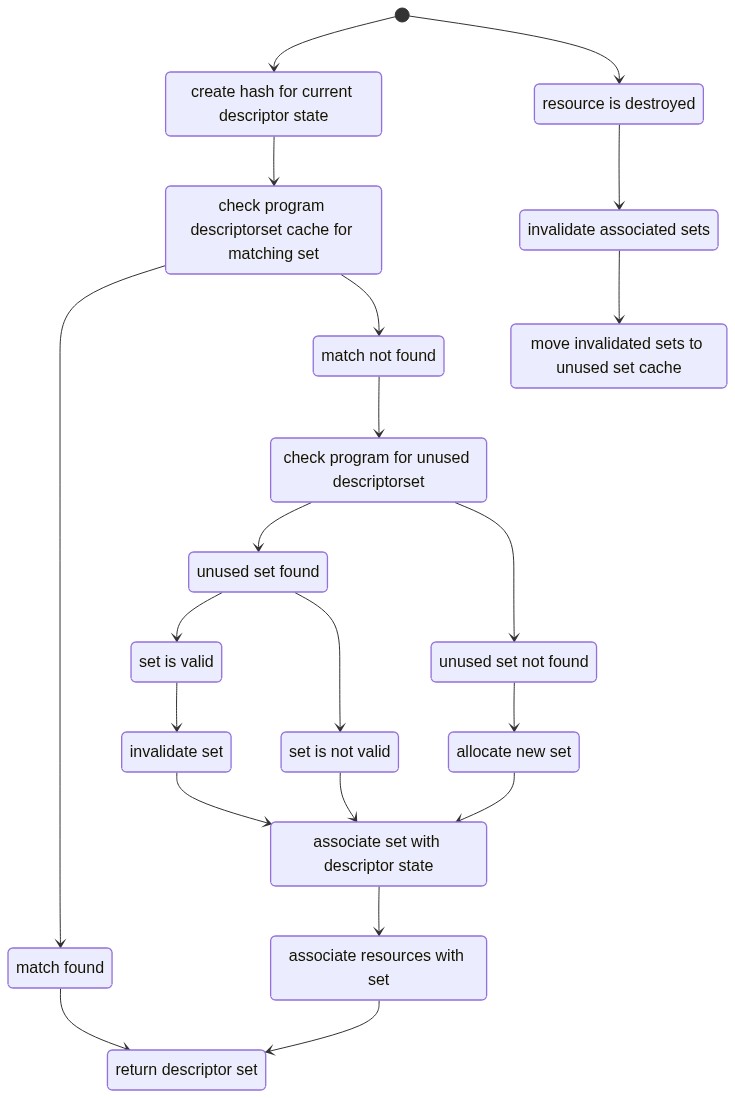
In this way, I’d get to conserve some sets and reuse them across draw calls even between different command buffers since I could track whether they were in use and avoid modifying them in any way. I’d also get to remove any tracking for descriptorset usage on batches, thereby removing possible queue submissions there. Any time resources in a set were destroyed, I could keep references to the sets on the resources and then invalidate the sets, returning them to the unused pool.
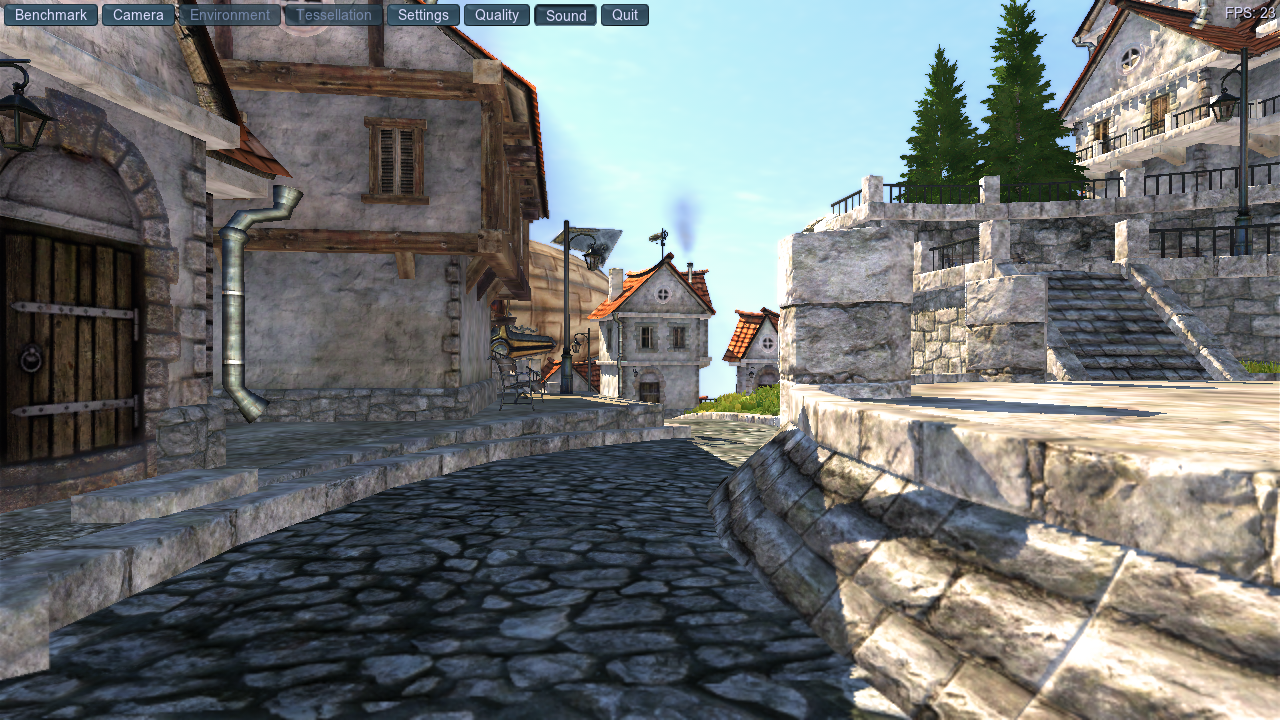
The results were great:
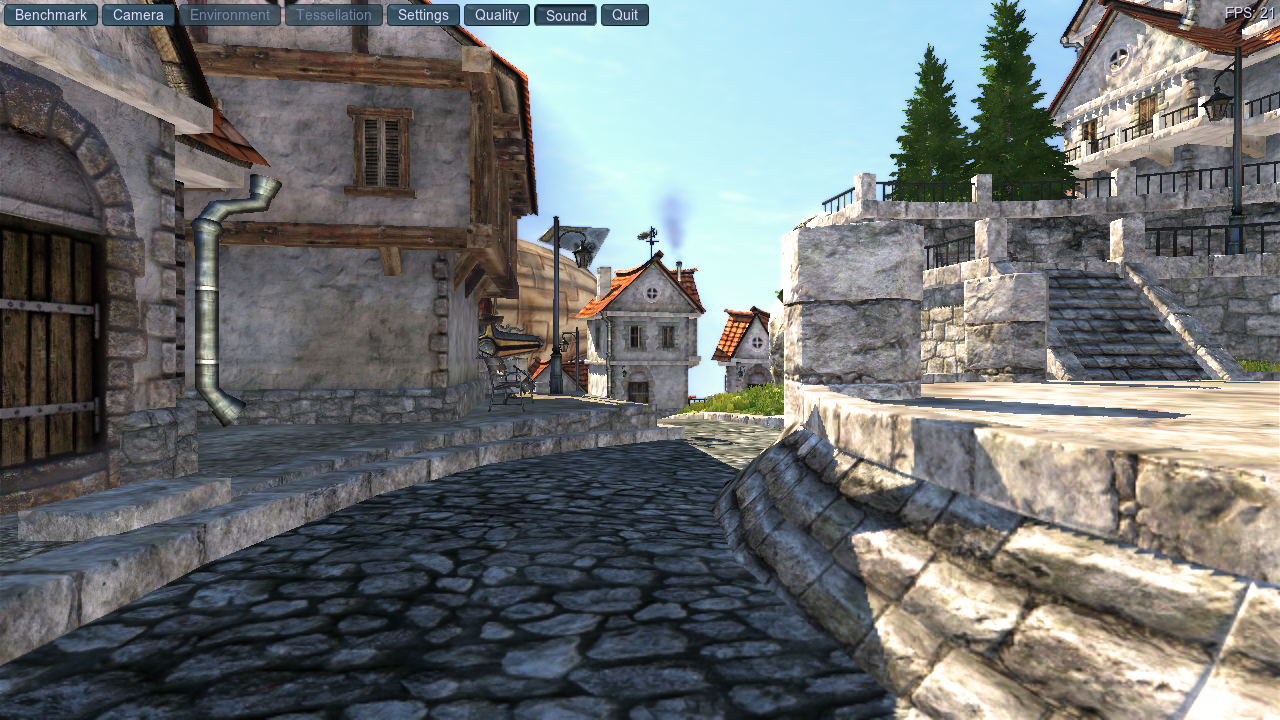
21 fps now, which is up another 3 from before.
Cache Improvements
Next I started investigating my cache implementation. There was a lot of hashing going on, as I was storing both the in-use sets as well as the unused sets (the valid and invalidated) based on the hash calculated for their descriptor usage, so I decided to try moving just the invalidated sets into an array as they no longer had a valid hash anyway, thereby giving quicker access to sets I knew to be free.
This would also help with my next plan, but again, the results were promising:
Now I was at 23 fps, which is another 10% from the last changes, and just from removing some of the hashing going on.
This is like shooting fish in a barrel now.
Naturally at this point I began to, as all developers do, consider bucketing my allocations, since I’d seen in my profiling that some of these programs were allocating thousands of sets to submit simultaneously across hundreds of draws. I ended up using a scaling factor here so that programs would initially begin allocating in tens of sets, scaling up by a factor of ten every time it reached that threshold (i.e., once 100 sets were allocated, it begins allocating 100 at a time).
This didn’t have any discernible effect on the fps, but there were certainly fewer allocation calls going on, so I imagine the results will show up somewhere else.
And Then I Thought About It
Because sure, my efficient, possibly-overengineered descriptorset caching mechanism for reusing sets across draws and batches was cool, and it worked great, but was the overhead of all the hashing involved actually worse for performance than just using a dumb bucket allocator to set up and submit the same sets multiple times even in the same command buffer?
I’m not one of those types who refuses to acknowledge that other ideas can be better than the ones I personally prefer, so I smashed all of my descriptor info hashing out of the codebase and just used an array for storing unused sets. So now the mechanism looked like this:
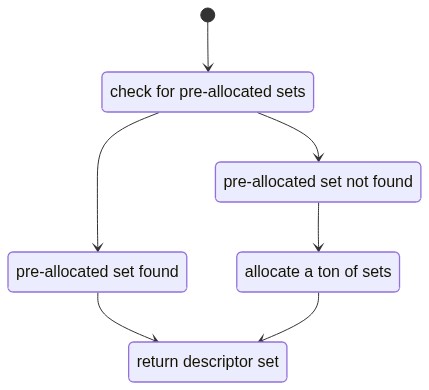
But would this be better than the more specific caching I was already using? Well…
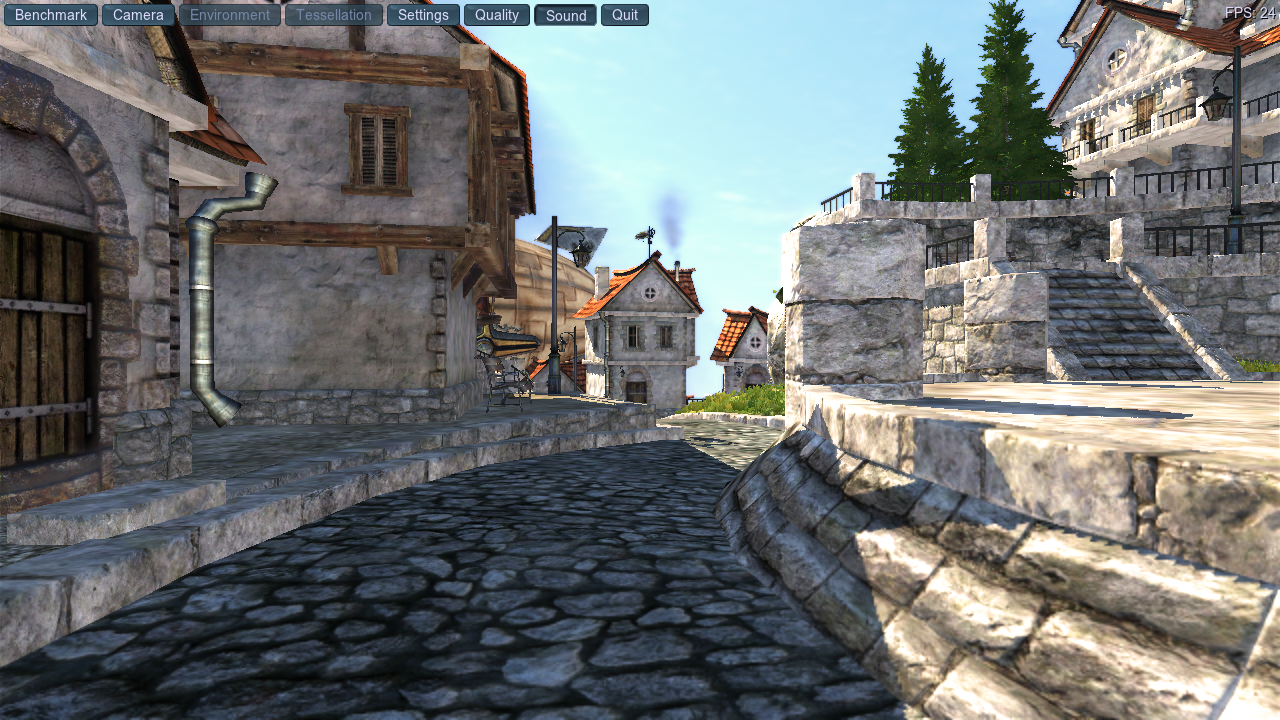
24 fps, so the short of it is yes. It was 1-2 fps faster across the board.
Conclusion
This is where I’m at now after spending some time also rewriting all the clear code again and fixing related regressions. The benchmark is up ~70% from where I started, and the gains just keep coming. I’ll post again about performance improvements in the future, but here’s a comparison to a native GL driver, namely IRIS:
Zink is at a little under 50% of the performance here, up from around 25% when I started, though this gap still varies throughout other sections of the benchmark, dipping as low as 30% of the IRIS performance in some parts.
It’s progress.