Back To Being Interesting
Moar Descriptors
I talked about a lot of boring optimization stuff yesterday, exploring various ideas which, while they will eventually will end up improving performance, didn’t yield immediate results.
Now it’s just about time to start getting to the payoff.
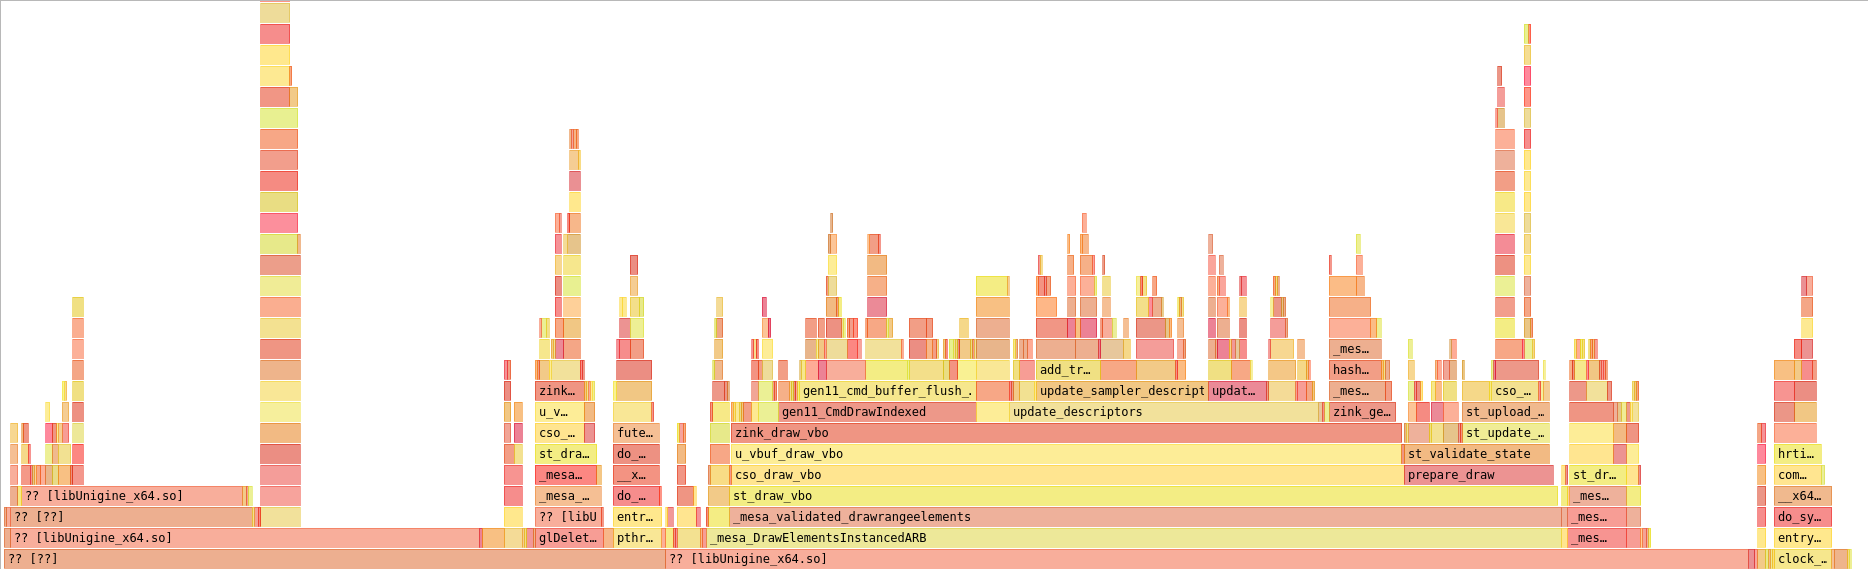
Here’s a flamegraph of the starting point. Since yesterday’s progress of improving the descriptor cache a bit and adding context-based descriptor states to reduce hashing, I’ve now implemented an object to hold the VkDescriptorPool, enabling the pools themselves to be shared across programs for reuse, which deduplicates a considerable amount of memory. The first scene of the heaven benchmark creates a whopping 91 zink_gfx_program structs, each of which previously had their own UBO descriptor pool and sampler descriptor pool for 182 descriptor pools in total, each with 5000 descriptors in it. With this mechanism, that’s cut down to 9 descriptor pools in total which are shared across all the programs. Without even changing that maximum descriptor limit, I’m already up by another frame to 28fps, even if the flamegraph doesn’t look too different.
Moar Caches
I took a quick detour next over to the pipeline cache (that large-ish block directly to the right of update_descriptors in the flamegraph), which stores all the VkPipeline objects that get created during startup. Pipeline creation is extremely costly, so it’s crucial that it be avoided during runtime. Happily, the current caching infrastructure in zink is sufficient to meet that standard, and there are no pipelines created while the scene is playing out.
But I thought to myself: what about VkPipelineCache for startup time improvement while I’m here?
I had high hopes for this, and it was quick and easy to add in, but ultimately even with the cache implemented and working, I saw no benefit in any part of the benchmark.
That was fine, since what I was really shooting for was a result more like this:
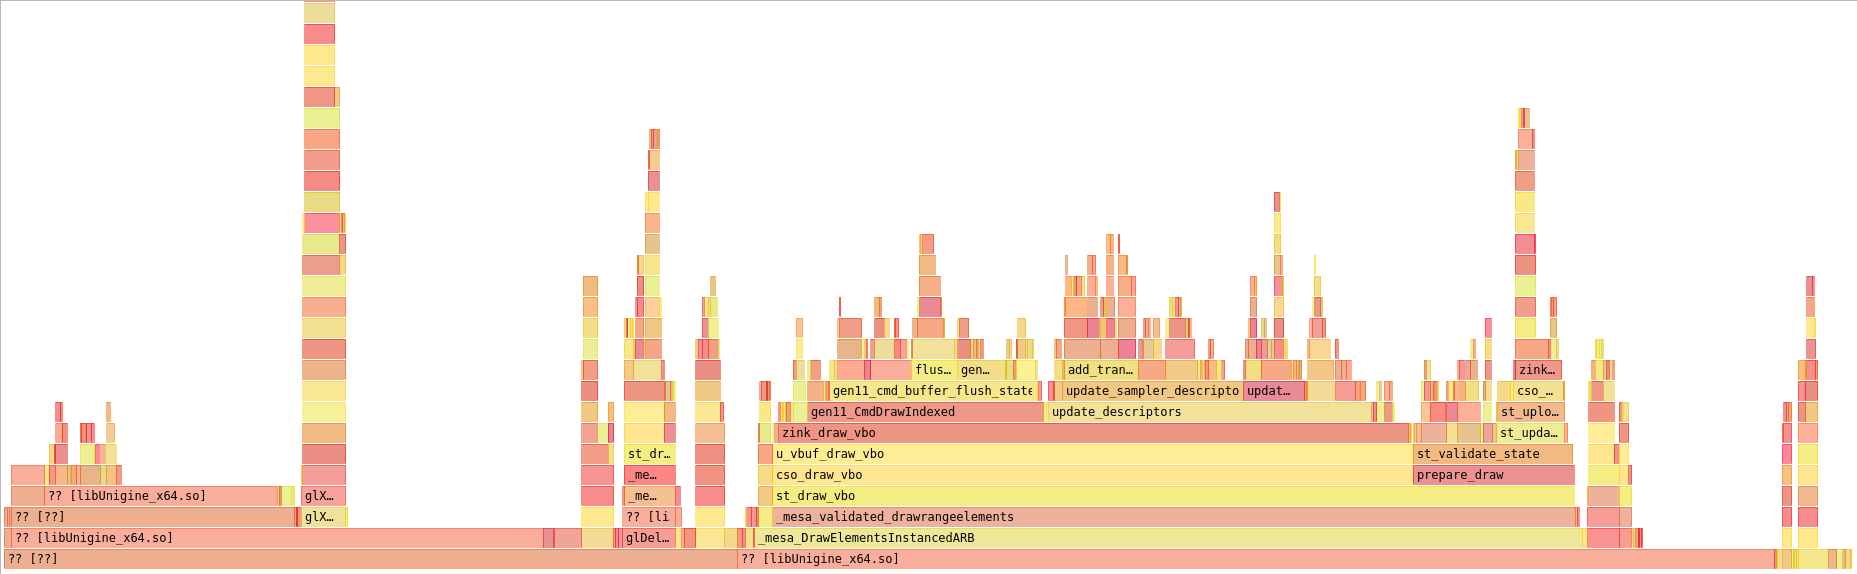
The hierarchy of the previously-expensive pipeline hash usage has completely collapsed now, and it’s basically nonexistent. This was achieved through a series of five patches which:
- moved the tessellation levels for TCS output out of the pipeline state since these have no relation and I don’t know why I put them there to begin with
- used the bitmasks for vertex divisors and buffers to much more selectively hash the large (32) VkVertexInputBindingDivisorDescriptionEXT and VkVertexInputBindingDescription arrays in the pipeline state instead of always hashing the full array
- also only hashed the vertex buffer state if we don’t have VK_EXT_extended_dynamic_state support, which lets that be removed from the pipeline creation altogether
- for debug builds, which are the only builds I run, I changed the pipeline hash tables over to use the pre-hashed values directly since mesa has a pesky
assert()that rehashes on every lookup, so this more accurately reflects release build performance
And I’m now up to a solid 29fps.
Over To update_sampler_descriptors()
I left off yesterday with a list of targets to hit in this function, from left to right in the most recent flamegraph:
- add_transition(), which is a function for accumulating and merging memory barriers for resources using a hash table
- bind_descriptors(), which calls vkUpdateDescriptorSets and vkCmdBindDescriptorSets
- handle_image_descriptor(), which is a helper for setting up sampler/image descriptors
Looking higher up the chain for the add_transition() usage, it turns out that a huge chunk of this was actually the hash table rehashing itself every time it resized when new members were added (mesa hash tables start out with a very small maximum number of entries and then increase by a power of 2 every time). Since I always know ahead of time the maximum number of entries I’ll have in a given descriptor set, I put up a MR to let me pre-size the table, preventing any of this nonsense from taking up CPU time. The results were good:
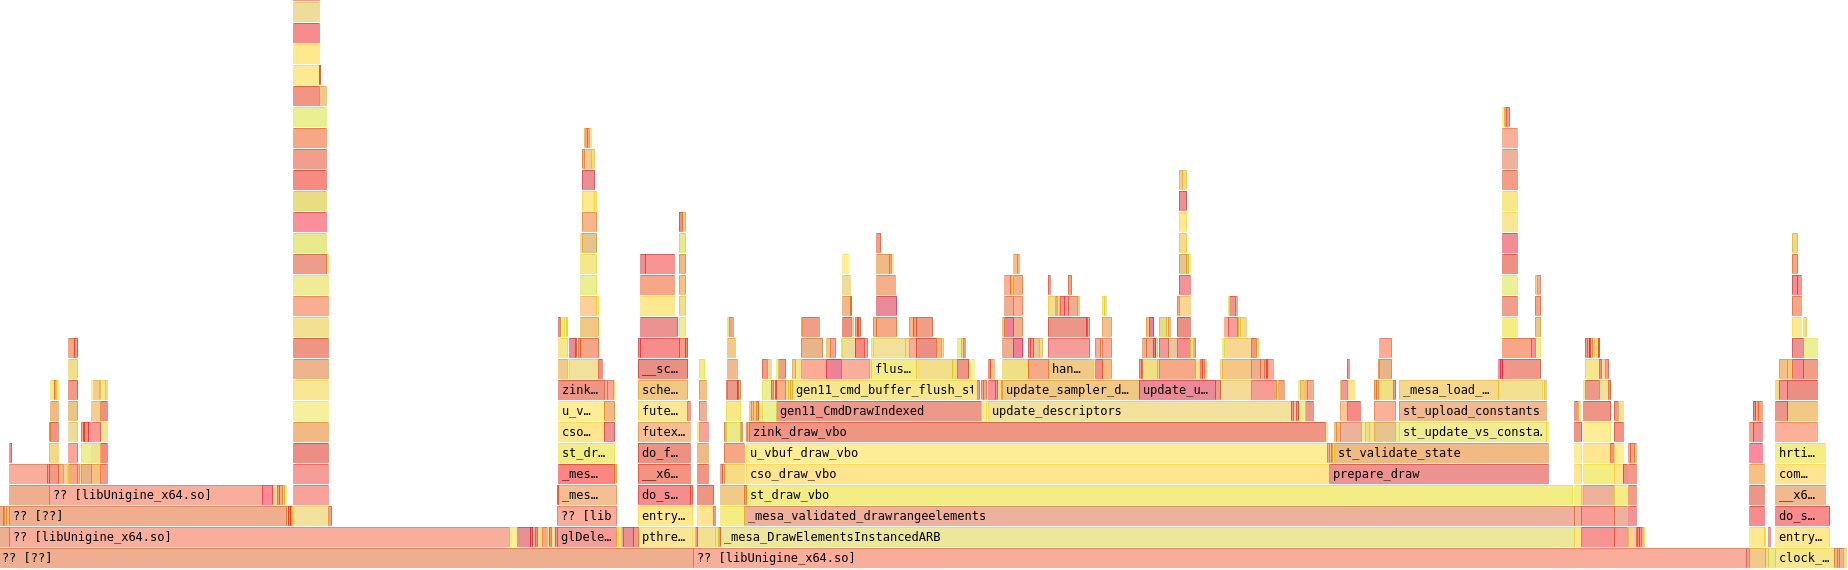
The entire add_transition hierarchy collapsed a bit, but there’s more to come. I immediately became distracted when I came to the realization that I’d actually misplaced a frame at some point and set to hunting it down.
Vulkan Experts
Anyone who said to themselves “you’re binding your descriptors before you’re emitting your pipeline barriers, thus starting and stopping your render passes repeatedly during each draw” as the answer to yesterday’s question about what I broke during refactoring was totally right, so bonus points to everyone out there who nailed it. This can actually be seen in the flamegraph as the tall stack above update_ubo_descriptors(), which is the block to the right of update_sampler_descriptors().
Oops.
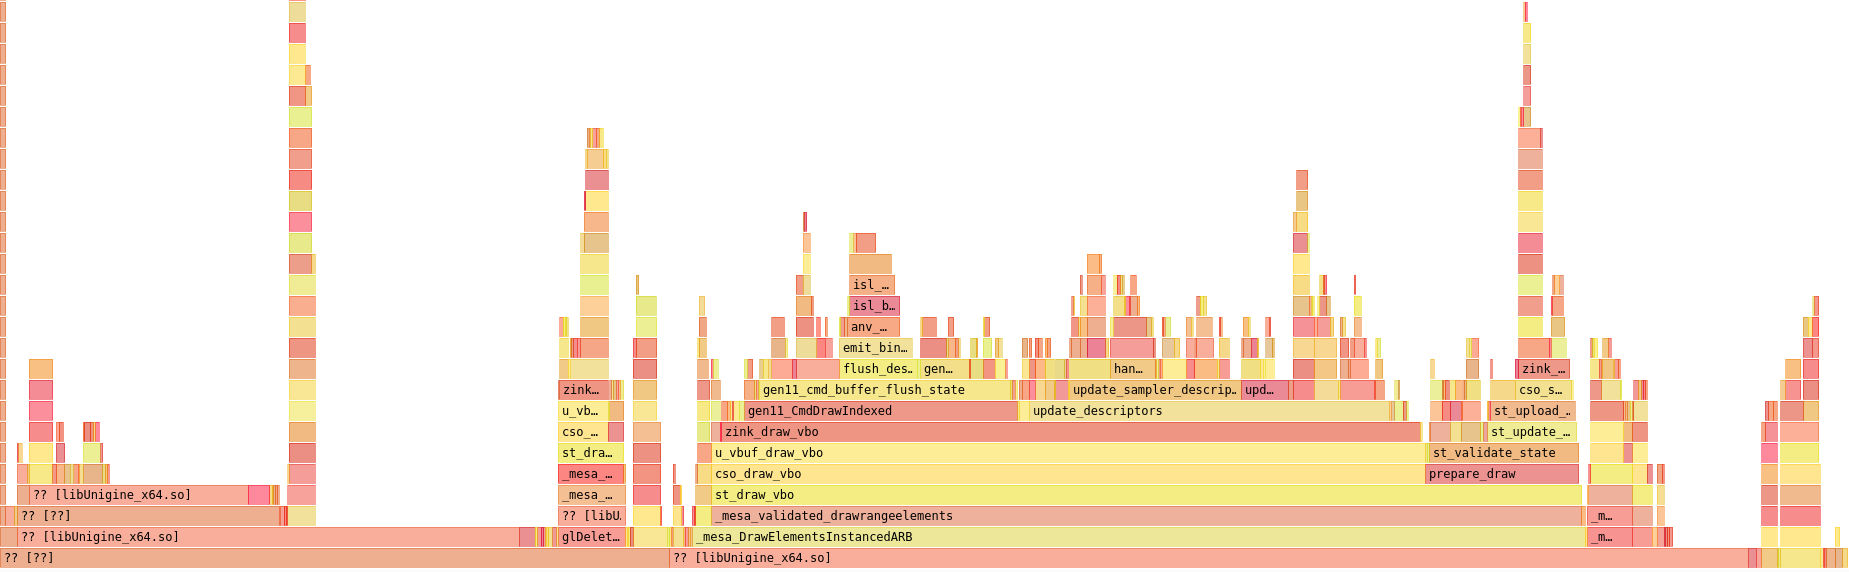
Now the stack is a little to the right where it belongs, and I was now just barely touching 30fps, which is up about 10% from the start of today’s post.
Stay tuned next week, when I pull another 10% performance out of my magic hat and also fix RADV corruption.