Accelerate
Finally, Performance
For a long time now, I’ve been writing about various work I’ve done in the course of getting to GL 4.6. This has generally been feature implementation work with an occasional side of bug hunting and fixing and so I haven’t been too concerned about performance.
I’m not done with feature work. There’s still tons of things missing that I’m planning to work on.
I’m not done with bug hunting or fixing. There’s still tons of bugs (like how currently spec@!opengl 1.1@streaming-texture-leak ooms my system and crashes all the other tests trying to run in parallel) that I’m going to fix.
But I wanted a break, and I wanted to learn some new parts of the graphics pipeline instead of just slapping more extensions in.
For the moment, I’ve been focusing on the Unigine Heaven benchmark since there’s tons of room for improvement, though I’m planning to move on from that once I get bored and/or hit a wall. Here’s my starting point, which is taken from the patch in my branch with the summary zink: add batch flag to determine if batch is currently in renderpass, some 300ish patches ahead of the main branch’s tip:
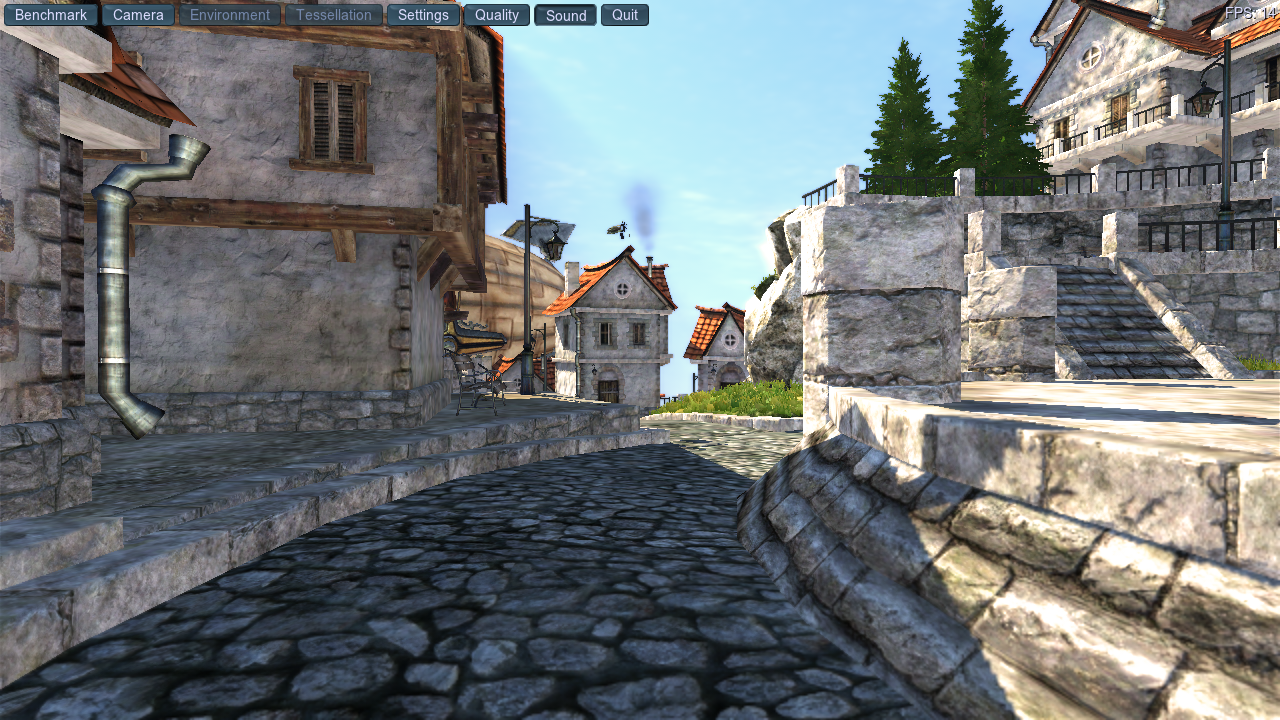
This is 14 fps running as ./heaven_x64 -project_name Heaven -data_path ../ -engine_config ../data/heaven_4.0.cfg -system_script heaven/unigine.cpp -sound_app openal -video_app opengl -video_multisample 0 -video_fullscreen 0 -video_mode 3 -extern_define ,RELEASE,LANGUAGE_EN,QUALITY_LOW,TESSELLATION_DISABLED -extern_plugin ,GPUMonitor, and I’m going to be posting screenshots from roughly the same point in the demo as I progress to gauge progress.
Is this an amazing way to do a benchmark?
No.
Is it a quick way to determine if I’m making things better or worse right now?
Given the size of the gains I’m making, absolutely.
Let’s begin.
Architecture
Now that I’ve lured everyone in with promises of gains and a screenshot with an fps counter, what I really want to talk about is code.
In order to figure out the most significant performance improvements for zink, it’s important to understand the architecture. At the point when I started, zink’s batches (C name for an object containing a command buffer and a fence as well as references to all the objects submitted to the queue for lifetime validation) worked like this for draw commands:
- there are 4 batches (and 1 compute batch, but that’s out of scope)
- each batch has 1 command buffer
- each batch has 1 descriptor pool
- each batch can allocate at most 1000 descriptor sets
- each descriptor set is a fixed size of 1000 of each type of supported descriptor (UBO, SSBO, samplers, uniform and storage texel buffers, images)
- each batch, upon reaching 1000 descriptor sets, will automatically submit its command buffer and cycle to the next batch
- each batch has 1 fence
- each batch, before being reused, waits on its fence and then resets its state
- each batch, during its state reset, destroys all its allocated descriptor sets
- renderpasses are started and ended on a given batch as needed
- renderpasses, when ended, trigger queue submission for the given command buffer
- renderpasses allocate their descriptor set on-demand just prior to the actual
vkCmdBeginRenderPasscall - renderpasses, during corresponding descriptor set updates, trigger memory barriers on all descriptor resources for their intended usage
- pipelines are cached at runtime based on all the metadata used to create them, but we don’t currently do any on-disk pipeline caching
This is a lot to take in, so I’ll cut to some conclusions that I drew from these points:
- sequential draws cannot occur on a given batch unless none of the resources used by its descriptor sets require memory barriers
- because barriers cannot be submitted during a renderpass
- this is very unlikely
- therefore, each batch contains exactly 1 draw command
- each sequential draw after the fourth one causes explicit fence waiting
- batches must reset their state before being reused, and prior to this they wait on their fence
- there are 4 batches
- this means that any time a frame contains more than 4 draws, zink is pausing to wait for batches to finish so it can get a valid command buffer to use
- the Heaven benchmark contains hundreds of draw commands per frame
- yikes
- definitely there could be better barrier usage
- a barrier should only be necessary for zink’s uses when: transitioning a resource from write -> read, write -> write, or changing image layouts, and for other cases we can just track the usage in order to trigger a barrier later when one of these conditions is met
- the
pipe_context::flushhook in general is very, very bad and needs to be avoided- we use this basically every other line like we’re building a jenga tower
- sure would be a disaster if someone were to try removing these calls
- probably we could do some disk caching for pipeline objects so that successive runs of applications could use pre-baked objects and avoid needing to create any
- descriptor set allocation is going to be a massive performance hit for any application which does lots of draws per frame since each draw command allocates its own (huge) descriptor set
- the 1000 descriptor set limit is going to be hit constantly for for any application which does lots of draws per frame
There’s a lot more I could go into here, but this is already a lot.
Removing Renderpass Submission
I decided to start here since it was easy:
diff --git a/src/gallium/drivers/zink/zink_context.c b/src/gallium/drivers/zink/zink_context.c
index a9418430bb7..f07ae658115 100644
--- a/src/gallium/drivers/zink/zink_context.c
+++ b/src/gallium/drivers/zink/zink_context.c
@@ -800,12 +800,8 @@ struct zink_batch *
 zink_batch_no_rp(struct zink_context *ctx)
 {
    struct zink_batch *batch = zink_curr_batch(ctx);
-   if (batch->in_rp) {
-      /* flush batch and get a new one */
-      flush_batch(ctx);
-      batch = zink_curr_batch(ctx);
-      assert(!batch->in_rp);
-   }
+   zink_end_render_pass(ctx, batch);
+   assert(!batch->in_rp);
    return batch;
 }
Amazing, I know. Let’s see how much the fps changes:
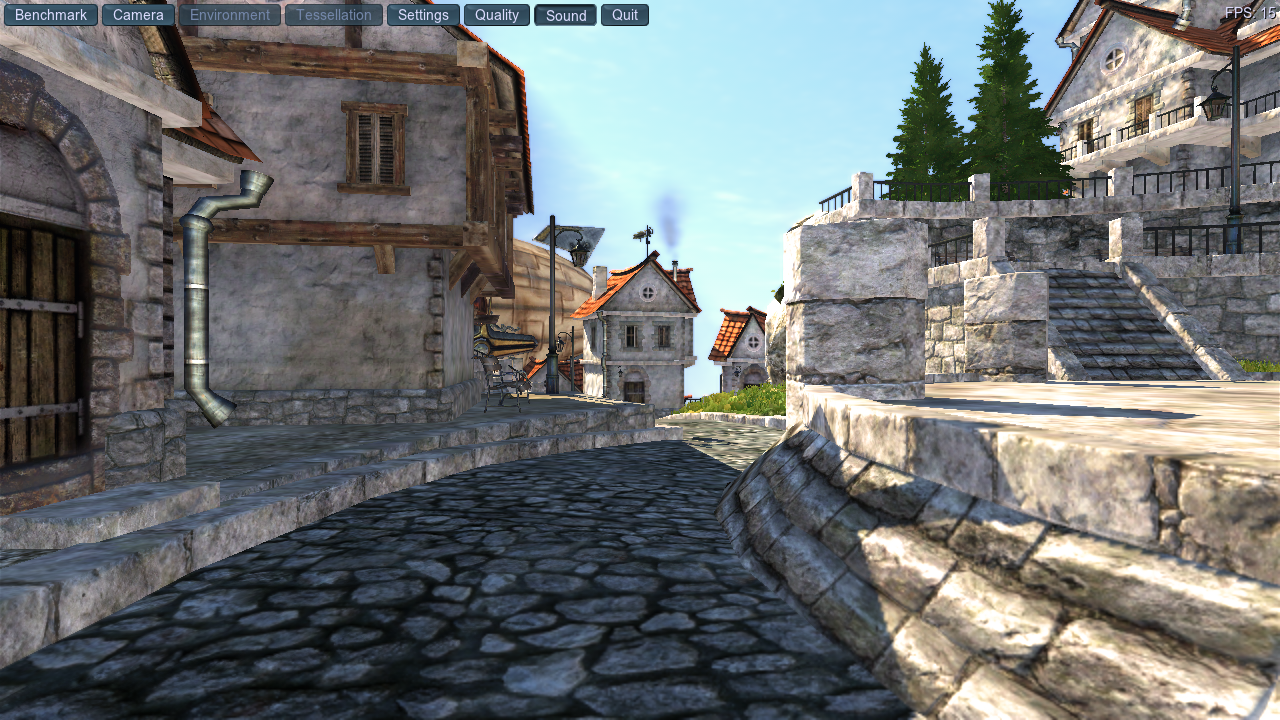
15?! Wait a minute. That’s basically within the margin of error!
It is actually a consistent 1-2 fps gain, even a little more in some other parts, but it seemed like it should’ve been more now that all the command buffers are being gloriously saturated, right?
Well, not exactly. Here’s a fun bit of code from the descriptor updating function:
struct zink_batch *batch = zink_batch_rp(ctx);
unsigned num_descriptors = ctx->curr_program->num_descriptors;
VkDescriptorSetLayout dsl = ctx->curr_program->dsl;

if (batch->descs_left < num_descriptors) {
   ctx->base.flush(&ctx->base, NULL, 0);
   batch = zink_batch_rp(ctx);
   assert(batch->descs_left >= num_descriptors);
}
Right. The flushing continues. And while I’m here, what does zink’s pipe_context::flush hook even look like again?
static void
zink_flush(struct pipe_context *pctx,
           struct pipe_fence_handle **pfence,
           enum pipe_flush_flags flags)
{
   struct zink_context *ctx = zink_context(pctx);

   struct zink_batch *batch = zink_curr_batch(ctx);
   flush_batch(ctx);
...
   /* HACK:
    * For some strange reason, we need to finish before presenting, or else
    * we start rendering on top of the back-buffer for the next frame. This
    * seems like a bug in the DRI-driver to me, because we really should
    * be properly protected by fences here, and the back-buffer should
    * either be swapped with the front-buffer, or blitted from. But for
    * some strange reason, neither of these things happen.
    */
   if (flags & PIPE_FLUSH_END_OF_FRAME)
      pctx->screen->fence_finish(pctx->screen, pctx,
                                 (struct pipe_fence_handle *)batch->fence,
                                 PIPE_TIMEOUT_INFINITE);
}
Oh. So really every time zink “finishes” a frame in this benchmark (which has already stalled hundreds of times up to this point), it then waits on that frame to finish instead of letting things outside the driver worry about that.
Borrowing Code
It was at this moment that a dim spark flickered to life in my memories, reminding me of the in-progress MR from Antonio Caggiano for caching surfaces on batches. In particular, it reminded me that his series has a patch which removes the above monstrosity.
Let’s see what happens when I add those patches in:
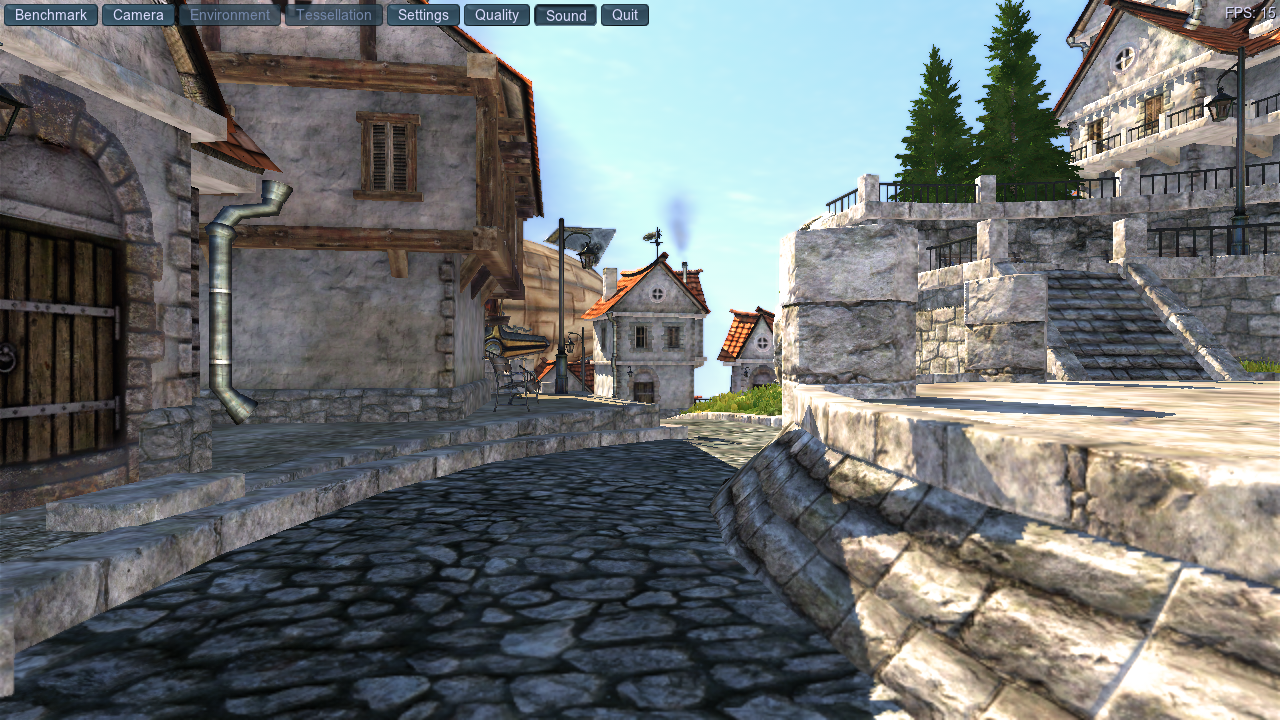
15.
Again.
I expected a huge performance win here, but it seems that we still can’t fully utilize all these changes and are still stuck at 15 fps. Every time descriptors are updated, the batch ends up hitting that arbitrary 1000 descriptor set limit, and then it submits the command buffer, so there’s still multiple batches being used for each frame.
Getting Mad
So naturally at this point I tried increasing the limit.
Then I increased it again.
And again.
And now I had exactly one flush per frame, but my fps was still fixed at a measly 15.
That’s when I decided to do some desk curls.
What happened next was shocking:
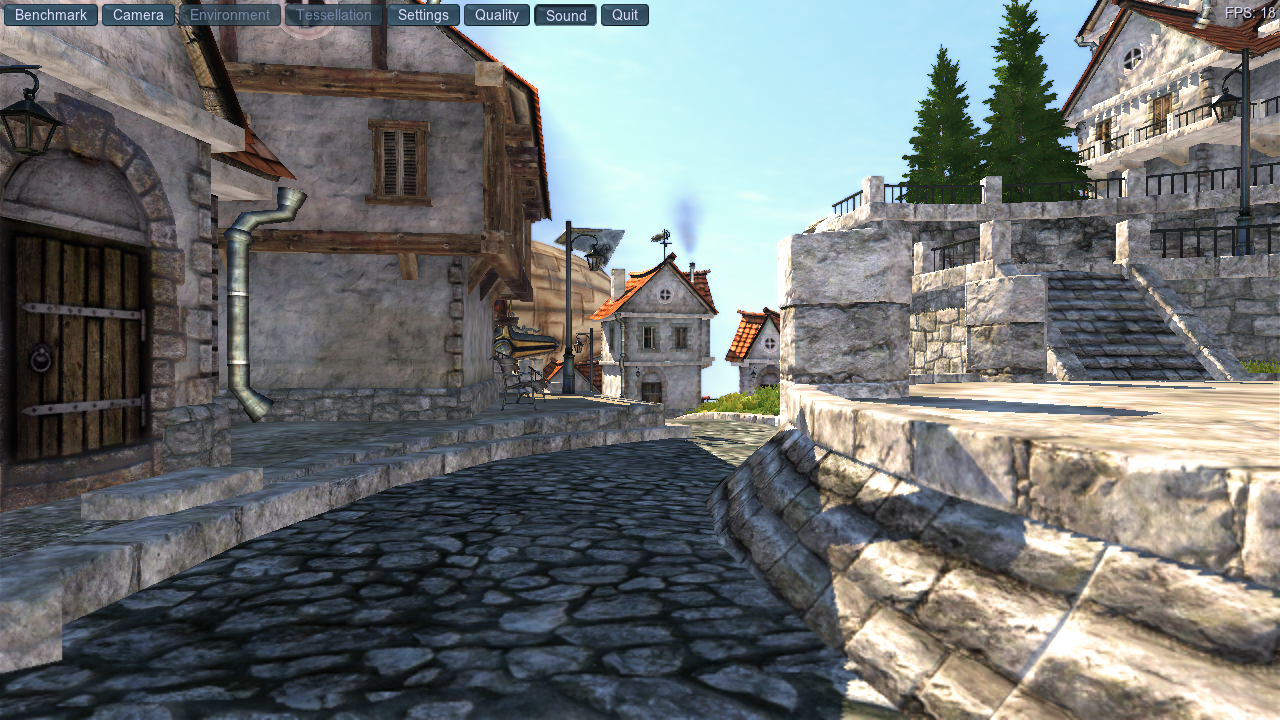
18 fps.
It was a sudden 20% fps gain, but it was only the beginning.
More on this tomorrow.